What are diagnostic tests?
A diagnostic test can be defined as ‘any kind of medical test performed to aid in the diagnosis or detection of disease, injury or any other medical condition’. Typically with any diagnostic test some of those at risk will be missed (false negatives) and some people not at risk will test positive (false positives).
Diagnostic tests can be compared against a gold standard test to evaluate their usefulness. The gold standard test refers to a diagnostic test that is the most accurate and best available under reasonable conditions. An example of a gold standard test is a CT pulmonary angiogram for the diagnosis of a pulmonary embolus. Gold standard tests tend to change over time as medical science advances.
If the results of the diagnostic test are compared with the gold-standard test in a simple 2 x 2 table various useful statistical measures can be determined that assist in the evaluation of the diagnostic test:
| Disease positive with gold-standard test | Disease negative with gold standard test | |
|---|---|---|
| Positive diagnostic test | A | B |
| Negative diagnostic test | C | D |
Sensitivity
Sensitivity is the proportion of true positives correctly identified by the test. It can be calculated from the 2 x 2 table by the following formula:
Sensitivity = A / A + C
SeNsitivity is used to rule OUT a disease, and this can be remembered using the mnemonic SNOUT. It is a good indicator of the ability of a diagnostic test to detect a disease when it is present.
A value approaching 1 is desirable for ruling out a disease and indicates a low false-negative rate. Sensitivity is best used when screening for diseases with a low prevalence.
Specificity
The specificity is the proportion of true negatives correctly identified by the test. It can be calculated from the 2 x 2 table by the following formula:
Specificity = D / B + D
SPecificity is used to rule a disease IN, and this can be remembered using the mnemonic SPIN. It is a good indicator of the ability of a diagnostic test to confirm the absence of a disease when it is not present
A value approaching 1 is desirable for ruling a disease in and indicates a low false-positive rate.
Positive predictive value
The positive predictive value (PPV) is the proportion of those who test positive who actually have the disease. It can be calculated from the 2 x 2 table by the following formula:
PPV = A / A + B
It is the proportion of positive test results that are true positives and it represents the probability that a person that tests positive actually has the disease. It is affected by the prevalence of a disease and tests that have high sensitivity and specificity will have a low positive predictive value if the prevalence of the disease is low.
Negative predictive value
The negative predictive value (NPV) is the proportion of those who test negative who do not have the disease. It can be calculated from the 2 x 2 table by the following formula:
NPV = D / C + D
It is the proportion of negative test results that are true negatives and it represents the probability that a person that tests negative is actually disease free.
Like the positive predictive value, the negative predictive value is also dependant upon the prevalence of the disease, and will vary between populations.
Likelihood ratios
Likelihood ratios are another means of assessing the value of performing a diagnostic test. They are considered to be more useful than predictive values when determining whether a test result usefully changes the probability that a disease state is present. Because they are calculated from the sensitivity and specificity of the test they are independent of prevalence.
The likelihood ratio (LR+) for a positive test result can be calculated using the following formula:
LR + = sensitivity / 1 – specificity
The likelihood ratio (LR-) for a negative test result can be calculated using the following formula:
LR- = 1- sensitivity / specificity
In summary, a likelihood ratio:
- Applies to a piece of diagnostic information
- Tells you how useful that information is when making a diagnosis
- Is a number between zero and infinity
- If greater than one, indicates that the information increases the likelihood of the suspected diagnosis
- If less than one, indicates that the information decreases the likelihood of the suspected diagnosis
Pre- and post-test probabilities
The pre-test probability is the proportion of people in the population who have the disease at a specific time or time interval. This is essentially the point prevalence or the period prevalence of the disease. Pre-test probabilities in medicine can be estimated using a clinician’s judgment.
Post-test probability is the proportion of patients testing positive who truly have the disease. It is similar to the positive predictive value and represents the probability of the patient having a disease taking into account the results of the test.
The Fagan nomogram, also referred to as the likelihood ratio nomogram, can be used to determine the post-test probability by using the pre-test probability and the likelihood ratio.
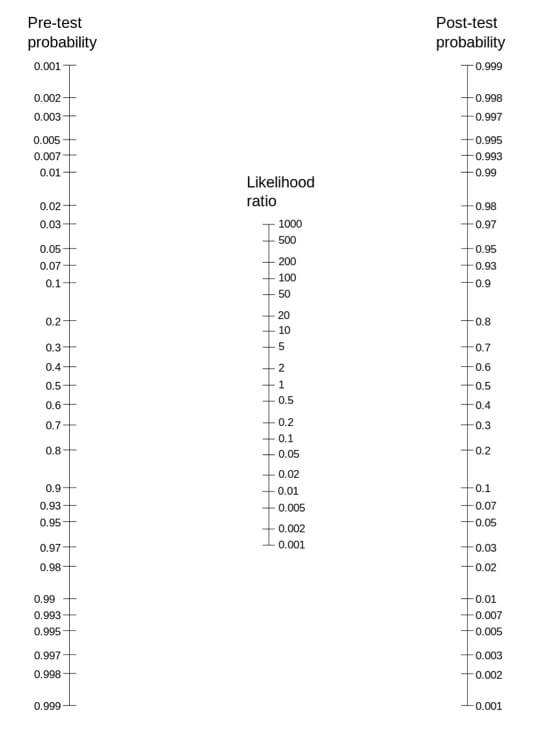
The Fagan nomogram
If a line is plotted connecting the pre-test probability and the calculated likelihood ratio it will intersect at the post-test probability on the right hand side of the Fagan nomogram.
Receiver operating characteristic curve
A receiver operating characteristic (ROC) curve is a graph used to assess diagnostic tests. The cut off point for a positive and negative test is varied and then the sensitivity and specificity for each of these cut off is calculated. A perfect test has a ROC curve that passes through the upper left corner (100% sensitivity, 100% specificity). Therefore the closer the ROC curve is to the upper left corner, the higher the overall accuracy of the test.
The area under the curve is a measure of how good the test is:
- 1 = perfect test
- 0.5 = test no better than chance
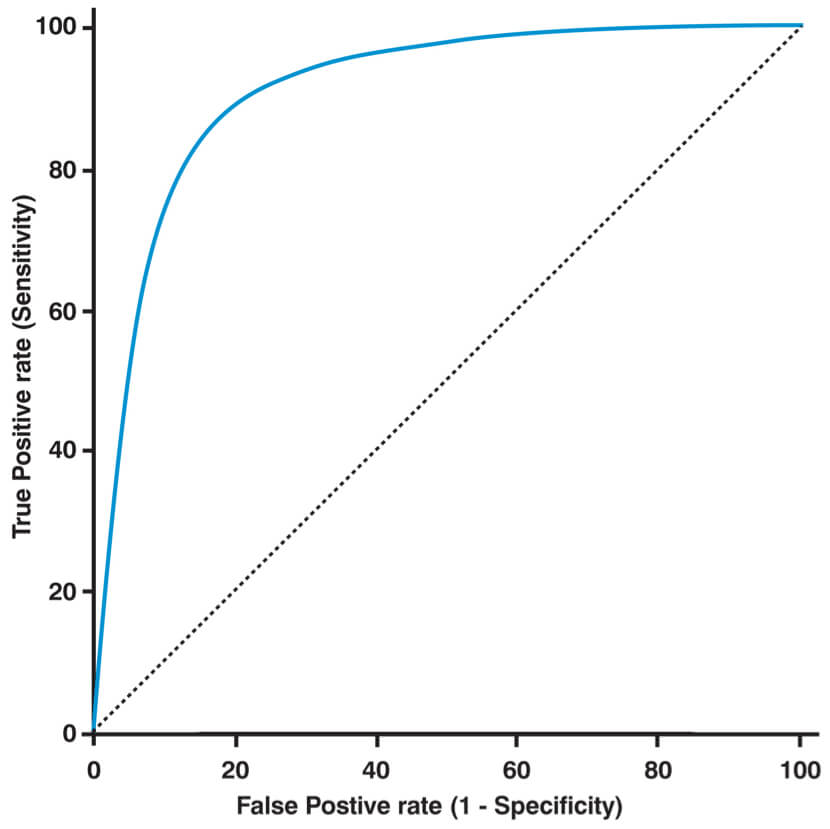
ROC curve
Worked example
Once again the best way to solidify an understanding of these concepts is to work through an example. Consider a new troponin assay that is being assessed on its ability to detect non-ST elevation myocardial infarction (NSTEMI). It was used in 1820 patients at 6 hours after the onset of chest pain. In patients with a positive troponin assay the presence of an NSTEMI was confirmed or refuted using angiography as the gold standard test.
The 2 by 2 table below displays the results:
| Positive angiogram | Negative angiogram | |
|---|---|---|
| Positive troponin test | 260 | 32 |
| Negative troponin test | 45 | 1483 |
The sensitivity can be calculated by:
Sensitivity = A / A + C
Sensitivity = 260 / (260 + 45)
Sensitivity = 0.85
The specificity can be calculated by:
Specificity = D / B + D
Specificity = 1483 / (1483 + 32)
Specificity = 0.98
The positive predictive value can be calculated by:
PPV = A / A + B
PPV = 260 / (260 + 32)
PPV = 0.89
The negative predictive can be calculated by:
NPV = D / C + D
NPV = 1483 / (45 + 1483)
NPV = 0.97
The likelihood ratio (LR+) for a positive test result can be calculated by:
LR + = sensitivity / 1 – specificity
LR + = 0.85 / (1 – 0.98)
LR + = 42.5
The likelihood ratio (LR-) for a negative test result can be calculated by:
LR – = 1 – sensitivity / specificity
LR + = (1 – 0.85) / 0.98
LR + = 0.153
Header image used on licence from Shutterstock
Medical Exam Prep would like to thank Dr. Marc Barton for permission to reproduce this extract from his book ‘Evidence-Based Medicine & Statistics for Medical Exams’
About Dr. Marc Barton
Dr. Marc Barton qualified from Imperial College School of Medicine in 2001. Since that time he has worked in a variety of different medical specialities. He worked as a GP partner from 2006 until 2008 and more recently as a higher specialist trainee in Emergency Medicine.
‘Evidence-Based Medicine & Statistics for Medical Exams’ is available for purchase here.