Test your knowledge of the ECG rate, rhythm and axis with these questions.
1. Which of the following is the usual paper speed of an ECG?
A. 10 mm/sec
B. 25 mm/sec
C. 50 mm/sec
D. 75 mm/sec
E. 100 mm/sec
Show Answer
Answer: B. 25 mm/sec
The usual paper speed of an ECG is 25 mm/sec.
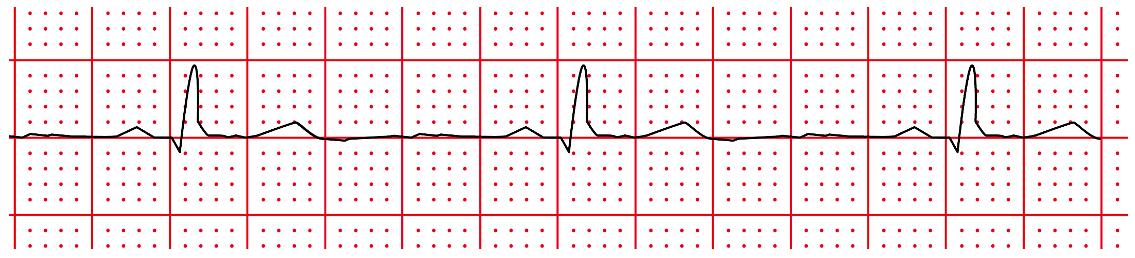
2. What is the heart rate in this rhythm strip?
A. 40 bpm
B. 50 bpm
C. 60 bpm
D. 70 bpm
E. 80 bpm
Show Answer
Answer: C. 60 bpm
The ECG rhythm strip shown in this question is normal sinus rhythm. The rate is approximately 60 beats per minute, and each QRS complex is clearly preceded by a P wave. The segments and intervals are all normal.
The heart rate can be calculated from the ECG using a number of different methods and depending upon the circumstances.
In most circumstances, when there is a regular rhythm, the simplest way to calculate the rate is by counting the number of ‘large squares’ between the ‘spike’ of each complex. These are the R waves, and this is called the ‘R-R interval’. By dividing 300 by this number, you will then have calculated the heart rate.
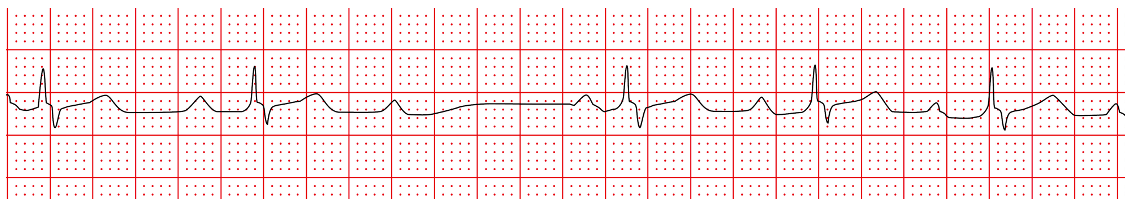
3. Which of the following heart rhythms is demonstrated?
A. Sinus bradycardia
B. 1st degree heart block
C. Wenckebach block
D. Mobitz type II AV block
E. Complete heart block
Show Answer
Answer: C. Wenckebach block
Mobitz type I AV block (also known as Wenckebach block) is a disease of the AV node. It is characterised by progressive prolongation of the PR interval until, ultimately, the atrial impulse fails to conduct, and a QRS complex is not generated. The PR interval is shortest in the first beat of the cycle.
Mobitz type I AV block is generally considered to be a benign rhythm that infrequently causes haemodynamic disturbance and has a low risk of progression to complete heart block. Asymptomatic patients require no treatment, and those that are symptomatic usually respond to the administration of atropine. Permanent pacing is rarely required.
4. Which of the following cardiac axis would be considered LEFT axis deviation?
A. +100 degrees
B. +50 degrees
C. -50 degrees
D. +120 degrees
E. -150 degrees
Show Answer
Answer: C. -50 degrees
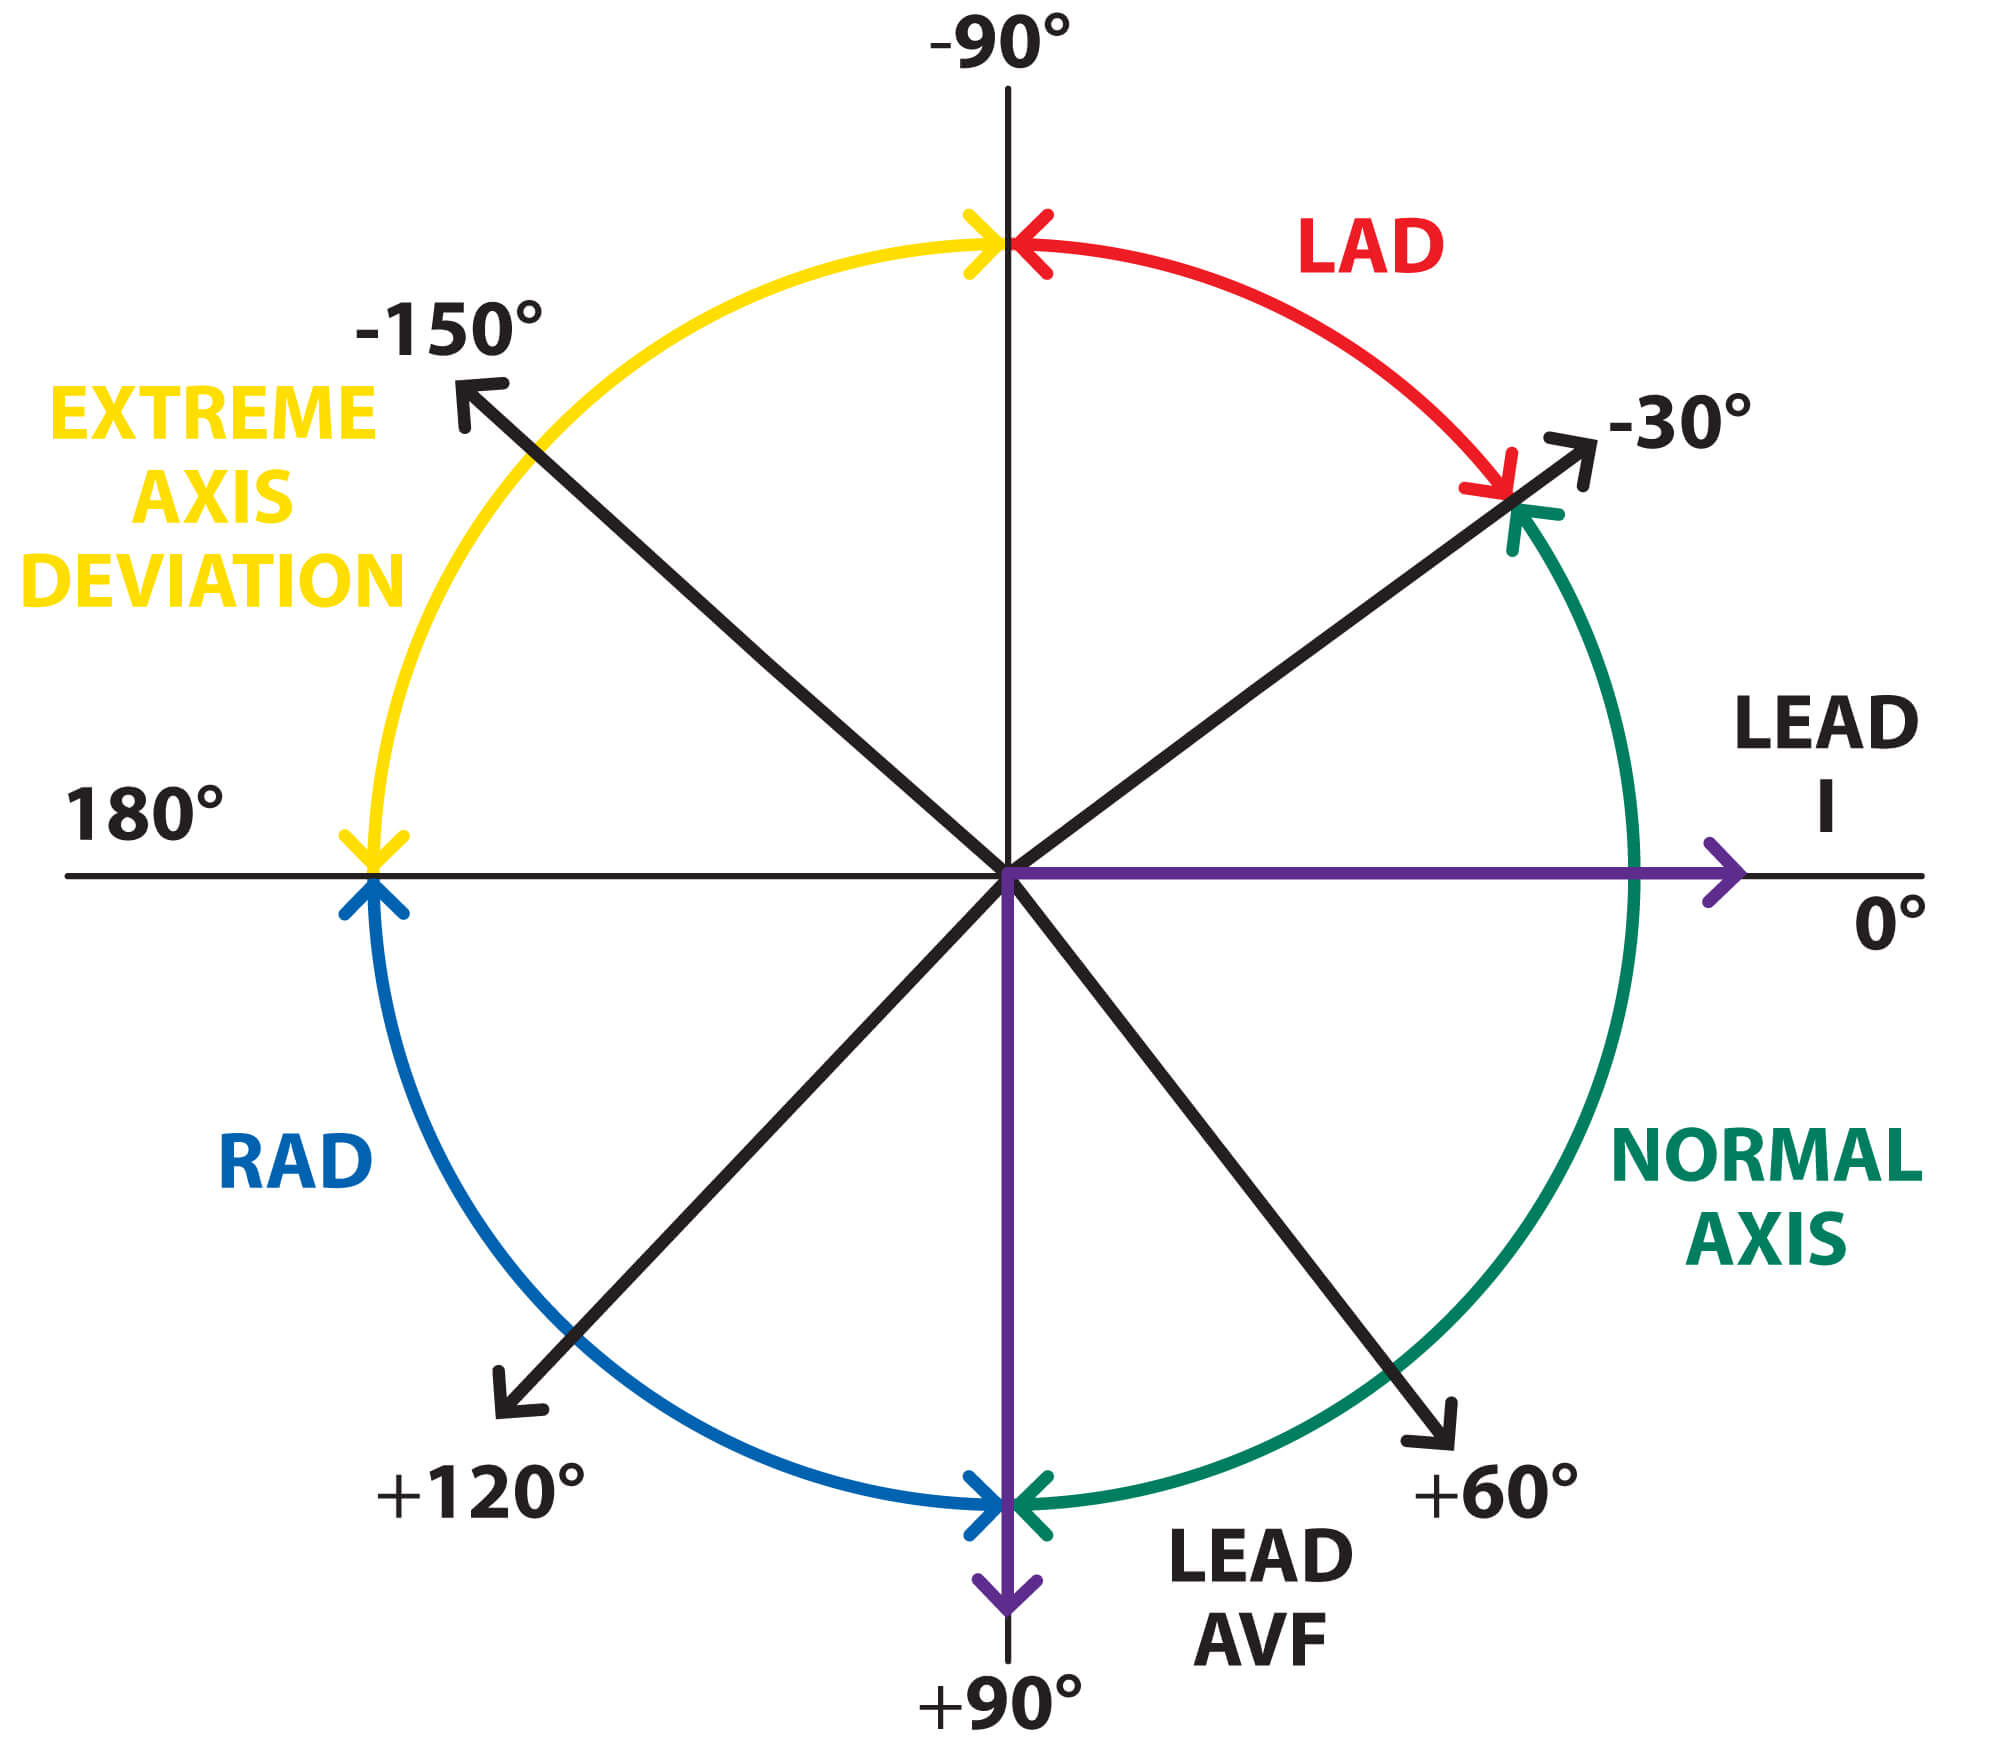
There are several ways of calculating the QRS axis, but the most efficient is the ‘quadrant method’.
The quadrant method works by looking at leads I and AVF. The ‘hexaxial system’ can be used to look at the relationship between the QRS axis, and these two leads:
© Medical Exam Prep
It can be seen that lead I cuts the hexaxial system in half horizontally (at +90 degrees), and lead AVF cuts the hexaxial system in half vertically (at 0 degrees). Therefore, these two leads can be used to divide the hexaxial system into four quadrants, and the QRS axis can be placed in one of those quadrants:
| Lead I | Lead AVF | Quadrant | Axis | Interpretation |
|---|---|---|---|---|
| Positive | Positive | Lower left | 0 to +90 degrees | Normal |
| Positive | Negative | Upper left | 0 to -90 degrees | Possible left axis deviation |
| Negative | Positive | Lower right | +90 to 180 degrees | Right axis deviation |
| Negative | Negative | Upper right | -90 to 180 degrees | Extreme axis deviation |
One limitation of this method is that the QRS axis can be up to -30 degrees into the upper left quadrant and still be considered normal. When the QRS axis is in this region (between 0 and -30 degrees), it is sometimes referred to as physiological left axis deviation. One way around this problem is to look closely at the QRS complex in lead II. When the QRS complex in lead II is positive, the axis is generally normal (physiological left axis deviation), but when the QRS complex in lead II is negative, there is left axis deviation present.
5. Which of the following is a recognised cause of right axis deviation on the ECG?
A. Lateral wall myocardial infarction
B. Left anterior fascicular block
C. Ostium primum ASD
D. Inferior myocardial infarction
E. Left bundle branch block
Show Answer
Answer: A. Lateral wall myocardial infarction
The QRS axis provides us with lots of useful information about the patient, and it is helpful to know some causes of both left axis deviation and right axis deviation when formulating a differential diagnosis based on the ECG findings. A list of a few of these causes is shown below:
| Left axis deviation | Right axis deviation |
|---|---|
| Normal (physiological axis deviation) Left ventricular hypertrophy Left bundle branch block Left anterior fascicular block Inferior myocardial infarction Wolff-Parkinson-White syndrome Ostium primum ASD | Right heart strain, e.g. P.E., COPD Right ventricular hypertrophy Right bundle branch block Left posterior fascicular block Lateral wall myocardial infarction Wolff-Parkinson White syndrome Ostium secundum ASD |
Header image used on licence from Shutterstock
Learn more about the ECG with our FREE ECG eBook ‘The Beginner’s Guide to the ECG’


very good
This is a great refresher course for me and u may turn out to be my teacher and I may become ecg expert
Excellent