
The term ‘acute coronary syndromes’ describes a group of clinical conditions, all of which usually present with chest pain as a consequence of myocardial ischaemia or infarction.
The acute coronary syndromes comprise:
- Unstable angina
- Non-ST elevation myocardial infarction
- ST elevation myocardial infarction
Unstable angina is defined by one or more of:
- Angina of effort occurring over a few days with increasing frequency provoked by progressively less exertion (‘crescendo angina’)
- Episodes of angina occurring recurrently and predictably, without specific provocation by exercise
- An unprovoked and prolonged episode of cardiac chest pain
The ECG in unstable angina may be normal or can show T wave or ST segment changes. The cardiac enzymes are usually normal in unstable angina.
Non-ST elevation myocardial infarction (NSTEMI) generally presents with typical cardiac chest pain that is sustained for greater than 20 minutes. The ECG usually shows T wave or ST segment changes and cardiac enzymes are usually raised.
ST elevation myocardial infarction (STEMI) generally presents with characteristic cardiac chest pain. The ECG shows ST segment elevation and development of Q waves and cardiac enzymes are raised.
Pathogenesis
These clinical syndromes form part of a spectrum of the same disease process. In the vast majority of cases this process is initiated by the fissuring of an atheromatous plaque in a coronary artery causing:
- Haemorrhage into the plaque causing it to swell and restrict the lumen of the artery
- Contraction of smooth muscle within the artery wall, causing further constriction of the lumen
- Thrombus formation on the surface of the plaque, which may cause partial or complete obstruction of the lumen of the artery, or distal embolism
Laboratory tests
A number of markers of cardiac damage are available. The following table is a guide to the timing of the initial rise, peak and return to normality:
| Marker | Initial Rise | Peak | Normal At | Notes |
|---|---|---|---|---|
| Creatine kinase | 4-8 hours | 18 hours | 2-3 days | CK-MB = main cardiac isoenzyme |
| Myoglobin | 1-4 hours | 6-7 hours | 24 hours | Low specificity from skeletal muscle damage |
| Troponin I | 3-12 hours | 24 hours | 3-10 days | Appears to be most sensitive and specific |
| HFABP | 1.5 hours | 5-10 hours | 24 hours | #NAME? |
| LDH | 10 hours | 24-48 hours | 14 days | Cardiac muscle mainly contains LDH |
Troponin I and T
Troponin assays are now commonly used in the diagnostic and prognostic assessment of patients presenting with acute coronary syndromes. Troponin I and T are sub-units of the complex that is involved in the regulation of the calcium-mediated contractile process of cardiac muscle. Troponin I takes up to 10 days to return to normal and Troponin T may take as long as 14 days.
The British Cardiac Society definition and prognosis of ACS depending on Troponin T at 12 hours is as follows:
| Troponin T < 0.01 | Troponin T > 0.01 and < 1.0 | Troponin T > 1.0 | |
|---|---|---|---|
| BCS definition | ACS with unstable angina | ACS with myocyte necrosis | ACS with clinical MI |
| 30 day mortality | 4.5% | 10.4% | 12.9% |
| 6 month mortality | 8.6% | 18.7% | 19.2% |
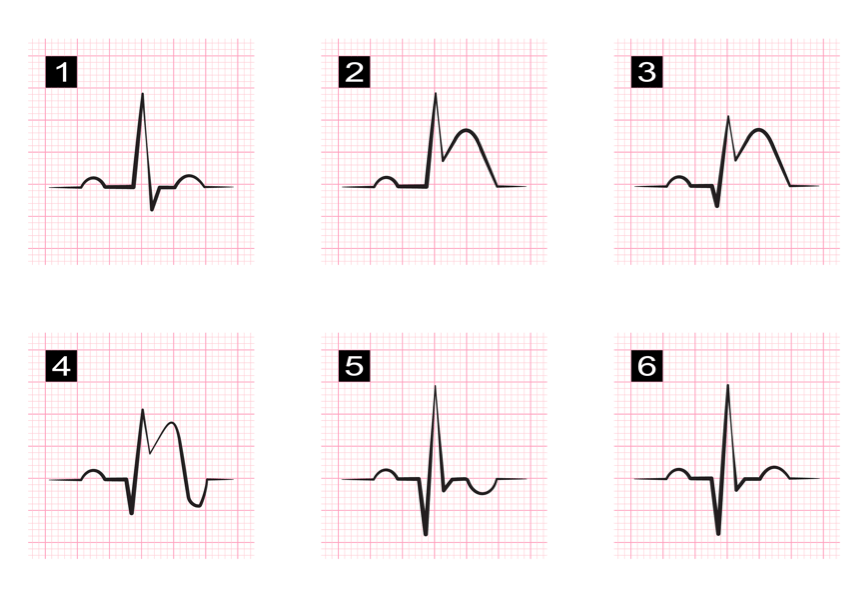
The ECG Changes Associated with STEMI
The earliest ECG change associated with a STEMI is an increase in the ventricular activation time. Infarcting myocardium is slower to conduct electrical impulses and, as a consequence, the interval between the start of the QRS and the apex of the R wave may be prolonged (> 0.045 s). Tall, positive, T waves can also be seen in the hyperacute phase of a myocardial infarction.
As the MI progresses, an upward sloping ST segment develops. The ST segment loses its normal upward concavity, straightens, then slopes upwards, before becoming elevated. Reciprocal ST depression may also be seen on the ‘opposite side’ of the heart. The ST segments then start to return to normal and T wave inversion frequently develops as this occurs.
Pathological Q waves develop, which represent significant myocardial necrosis and replacement by scar tissue, and reflect electrically inert necrotic myocardium.
Q waves are considered pathological if:
- > 40 ms wide (1 ‘small square’)
- > 2 mm in amplitude
- > 25% of the depth of the QRS complex
With time the ST segments revert to become iso-electric, unless a ventricular aneurysm develops. The T waves gradually become positive again, but the pathological Q waves usually remain.
The ECG changes associated with myocardial infarction*
The ECG criteria for a STEMI are as follows:
- ≥ 2 mm of ST segment elevation in 2 contiguous praecordial leads
- ≥ 1mm in other leads (2 contiguous)
- An initial Q wave or abnormal R wave develops over a period of several hours to days.
Localisation of Myocardial Infarction
Being able to localize the coronary artery implicated in a myocardial infarction provides valuable information for the clinician. The treatment and complications vary depending upon its location. For example, an anterior wall infarction can result in hypotension, tachycardia, shock and in the long-term, chronic heart failure can develop. By contrast, an inferior wall infarction is often accompanied by bradycardia because of involvement of the sinus node. The long-term effects of an inferior wall infarction are usually less severe than those of an anterior wall infarction. Having a good understanding of coronary artery anatomy is essential for being able to localize an MI.
Coronary Artery Anatomy
The left coronary artery arises from the aorta above the left cusp of the aortic valve. It supplies the left atrium, left ventricle, intraventricular septum and part of the left branch bundle of His. It is larger than the right coronary artery. It passes between the left side of the pulmonary trunk and the left auricle and then birfucates into the left anterior descending artery (LAD), which is also called the anterior interventricular branch, and the left circumflex artery (LCA). Sometimes an additional artery arises at the bifurcation called the ramus or intermediate artery.
The LAD follows the anterior interventricular groove towards the apex of the heart and then continues to the posterior surface of the heart to anastamose with the posterior interventricular branch.
The LCA follows the anterior interventricular groove to the left border of the heart and then proceeds to the posterior surface. It then gives rise to the left marginal branch, which follows the left border of the heart.
The right coronary artery arises above the right cusp of the aortic valve. It supplies the right atrium, the SA and AV nodes and the posterior part of the interventricular septum. It runs along the right atrioventricular groove before branching. The right marginal artery arises first and then the right coronary artery continues on to the posterior surface of the heart, still running in the right atrioventricular groove. The posterior descending artery (PDA), which is also called the posterior interventricular artery, arises next and then follows the posterior interventricular groove towards the apex of the heart.
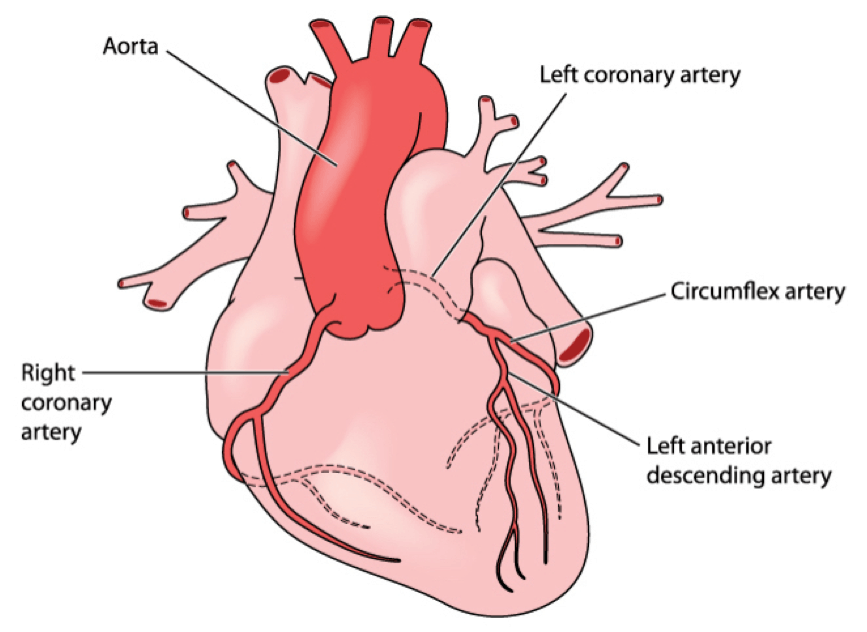
Coronary artery anatomy*
The following table summarizes the vessels involved in the various different types of myocardial infarction:
| ECG Leads | Location of MI | Vessel Involved |
|---|---|---|
| V1-V3 | Anteroseptal | Left anterior descending |
| V3-V4 | Anterior | Left anterior descending |
| V5-V6 | Anterolateral | Left anterior descending / left circumflex artery |
| V1-V6 | Extensive anterior | Left anterior descending |
| I, II, aVL, V6 | Lateral | Left circumflex artery |
| II, III, aVF | Inferior | Right coronary artery (80%) Left circumflex artery (20%) |
| V1, V4R | Right ventricle | Right coronary artery |
| V7-V9 | Posterior | Right coronary artery |
This illustrated version superimposed on an ECG should make this very clear:
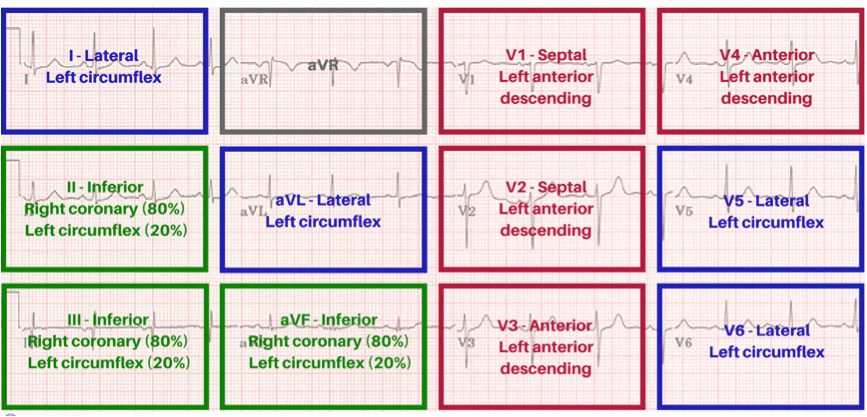
Localization of myocardial infarctions © Medical Exam Prep
*Images used on license from Shutterstock
Thank you to the joint editorial team of www.plabprep.co.uk for this article.


Good learning material for ACS